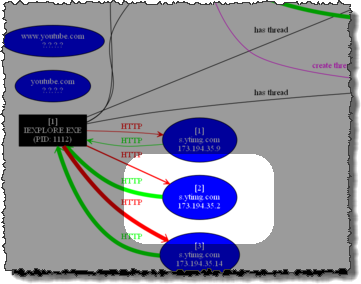
ProcDOT uses something called a graph to visualize informations (objects, activities, events and states) recorded on a system running Microsoft Windows.
A graph in ProcDOT (like any graph by definition) consists of nodes and edges.
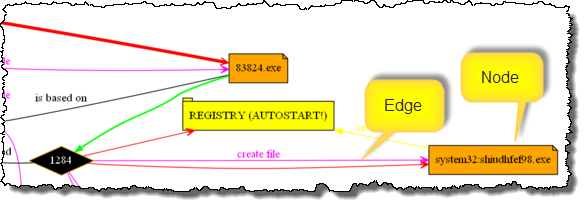
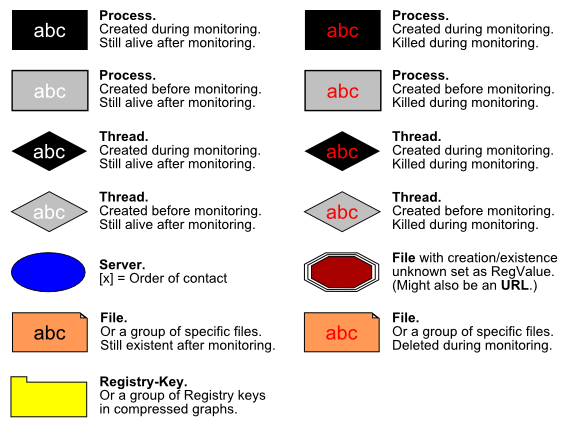
In this respect a node stands for an object like a ...
Nodes can have connections between each other.
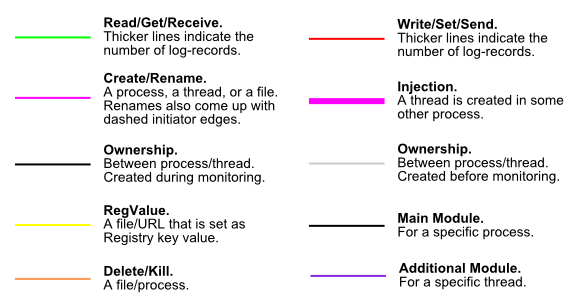
Such connections are visualized as lines and describe specific activities like
In "graph-speach" these lines are called edges.
Example:
The graph can be moved by moving your mouse while holding down the left mouse button (= draging).
Furthermore - if available - you can use the mouse wheel to scroll the graph vertically.
At any time a right double click resets the graph to its initial default settings in terms of position (center vertically and horizontally) and zoom level (= fit to canvas).
For zooming in or out the graph the current mouse position is used as center.
With a left double click the graph will be zoomed to 100% (1:1). Doing another left double click will bring you back to the previous zoom level.
To zoom the graph in smaller steps use the mouse wheel while holding down the Ctrl-key.
At any time a right double click resets the graph to its initial default settings in terms of zoom level (= fit to canvas) and position (center vertically and horizontally).
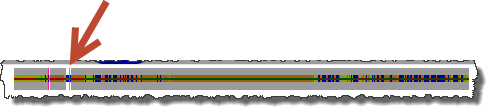
Left click on a node to select it. This furthermore highlights the node and all the frames in the timeline that are in some relation to the according node.
Right click on a node to (select it and) open a context sensitive menu.
At any time by pressing Ctrl+F you can open a search dialog to do a full text search in all of the data ProcDOT is currently holding for the graph.
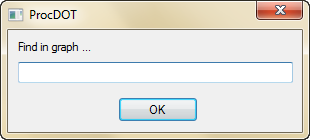
As a result any nodes and edges that contain the entered string will be highlighted.
Furthermore any frame (event) in the timeline that has one of the found nodes/edges as a role-player also gets highlighted.
For a quick switch between the available graph modes press the Return-key.