[2017-11-13] Version 1.21
I’m very proud to announce the new version 1.21!
Besides a bunch of bug fixes and performance tweeks (especially with plugins) there are also a flood of new features on board. Furthermore I decided to switch from the classic beta-test-and-
release model to a latest-build model beginning with this actual version. My idea is to have new functionalities faster available to the community while still having fallback versions around if
something breaks. Versions will get elevated to stable ones after some time if no problems/issues occur. However, this also means that you have to keep in mind to test latest builds in your
environment before you use them productively.
Another new aspect is that ProcDOT is now bundled with the most relevant of available plugins. However, please note that in terms of any issues with them you still have to get in touch with the
according author.
So, what’s new? Let’s begin with Brian Maloneys PCAP tools - a big thankyou to you Brian! While they aren’t entirely new they are now an essential part of ProcDOT lifting ProcDOT to a level
which already comes pretty close to what was my initial vision many years ago.
In this respect, this are the key features of Brians PCAP tools as they are bundled with this version of ProcDOT:
•
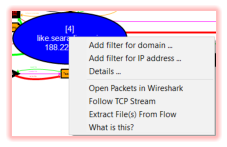
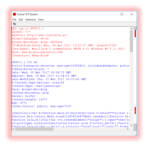
Follow TCP streams (like you would in Wireshark) through a server nodes context menu. Even better than
Wireshark: GZipped data will get uncompressed on the fly!
•
Open a servers packets directly in Wireshark. No more filtering needed in Wireshark therefore as you will just
get what you wanted.
•
Both of these packet inspection approaches are also available in frame/animation mode, so you can see the
actual packet. However, be aware that as we’re dealing with single packets in this mode ungzipping will get
affected of course. Just quickly switch back to static mode if you need/want to, easy like that. Anyway, please
understand this feature being a kind of “experimental” therefore.
•
Extract files from the entire PCAP.
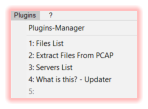
Besides the awesome PCAP tools plugins there’s another entirely new plugin on board now: My “What is this?” plugin. This plugin comes with a
database of generic explanations as well as specific descriptions for processes, files, registry keys and servers. This descriptions are not just
handy for an actual analysis, you can (and should!) also use them to learn something/more about Windows’ specific system activities. Just
monitor a couple of minutes using Procmon and browse the according system activities afterwards using dumb-mode, you’ll be surprised. Feel
free to drop me explanations for nodes which aren’t covered yet and I will happily add them to the online database which can be downloaded
by the plugin. Be sure to update the explanations database from time to time (through the according updater in the plugins mainmenu) as there
will be added missing descriptions and explanations frequently.
Last but not least - when it comes to bundled plugins - of course there are also the server- and the file-list plugins on-board.
What else is new? Animation mode now "cares" for the proper font-colors in terms of the current frame/animation progress. What does this mean? Think about the flow of process-, file-, etc.
activities. So far you only saw the static and final state of monitoring. In animation mode now the font color of a newly created and therefore living process essentially is white and will only turn
red by the time it’s actually killed. The same is true for the rest of the graph which results
in a much more realistic dynamic view.
As if that wouldn’t be already enough ... there are two more features available now,
features, a lot of you guys might be very excited of:
•
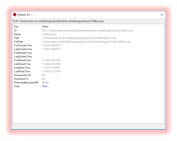
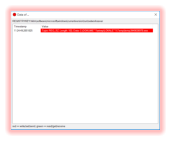
View of the actual data of registry key reads and writes.
•
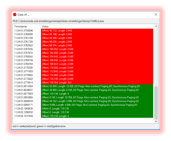
View of the details of file reads and writes - not to be confused with the actual
content, though. However, that still can provide you with interesting information
regarding file access algorithms for runtime decryption/unpacking or ransomware
related read/write approaches.
You will find those details under a files/registry keys context menu: “Details ...” => “Data
View ...”. Of course both flavours are animation/frame mode aware and highlight the proper line accordingly.
Happy graphing!
Chrisu
Blog


ProcDOT - Visual Malware Analysis Christian Wojner, 2022
